
Sometimes, it is a compiler bug
My journey in finding and fixing a bug in a C++ toolchain.
Written by strager on
Introduction
I was watching a programming Twitch stream when I noticed the coder make a mistake. I quickly pointed them to the quick-lint-js VS Code extension which I knew would highlight their mistake. My heart sank when quick-lint-js reported an error that didn't exist:
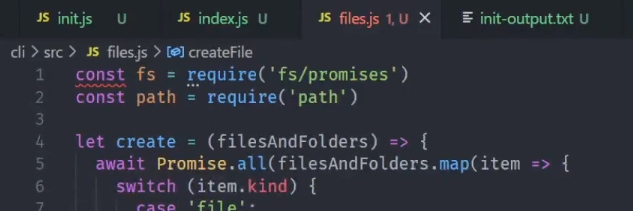
Source: ryan_the_rhg
Upon further investigation, a mistake did exist, but quick-lint-js reported the error at the wrong location. The mistake was on line 5, but quick-lint-js reported it on line 1:
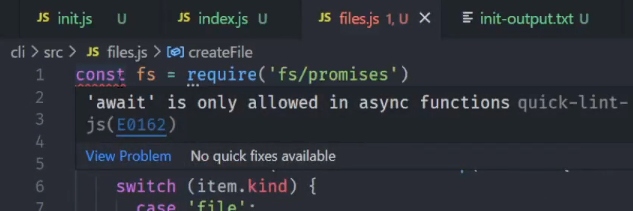
Source: ryan_the_rhg
This post chronicles the journey in finding, root-causing, and fixing this bug.
Reproducing the bug
The first step I took is to make the bug happen on my computer. I started by doing exactly what the streamer did: introduce a mistake in a JavaScript file, install the production version of quick-lint-js using the VS Code Marketplace, then close the extension tab. Of course, the bug didn't happen when I tried.
I tried a few more times, in case the bug was spurious. No luck.
Then I decided to upgrade VS Code. No repro.
Then I tried on Windows instead of Linux. No repro.
While streaming my repro attempts on my Twitch stream, one viewer, HPWebcamAble, said he encountered the problem too and could reproduce it. Nice! He posted a video of the bug. He was able to reproduce it by reloading VS Code. Unfortunately, I tried on my machine to no avail.
Hypothesis: The bug was a race condition, and a fast machine (like mine) didn't trigger the race condition.
I built an unoptimized version of the extension, hoping it would slow things down enough to trigger the race condition. The extension didn't work at all; it didn't even load. Oops, I forgot I had installed the 32-bit (x86) version of VS Code for testing, and I was building the 64-bit (x64) version of the extension.
I switched to the x64 version of VS Code and installed quick-lint-js from the VS Code Marketplace. The buggy squiggly appeared! I successfully reproduced the bug.
Hypothesis: The bug was specific to Windows x64 builds.
Isolating the bug
To investigate further, I needed to build the extension from source. When I tried, the bug didn't happen. Hmm.
The quick-lint-js VS Code extension is written in C++. You can build it with different C++ compilers:
- I originally tried a Debug build using MSVC (from Visual Studio 2022), but the bug didn't reproduce.
- Then I tried a Debug build using Clang (LLVM-MinGW), and the bug still didn't reproduce.
- Then I tried a Release build with GCC (MinGW), and I successfully reproduced the bug.
Now that I could change the code, my first instinct was to 🪵 add 🪵 logging 🪵 everywhere. I started by logging the line and character numbers calculated by the core quick-lint-js engine. Everything looked good.
Then I logged the
Diagnostic objects given to VS
Code. There was an obvious problem: the line and column numbers for
the first diagnostic were not integral:
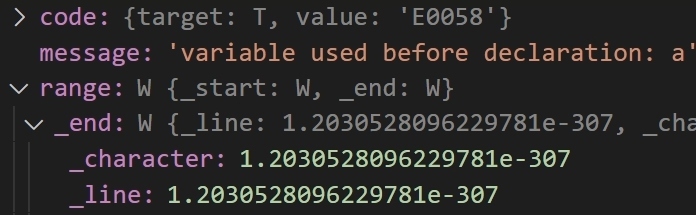
Diagnostic object
What the heck is
1.2030528096229781e-307 and
where is it coming from??
I tried hard-coding 42 as the
line number. The
Diagnostic object still had the
strange number.
I tried logging the number before I stored it in the
Diagnostic object. The log showed
the broken number, but the bug disappeared. When I added this extra
logging, I created a second JavaScript number object. I changed the
logging code to use the same number object as was given to the
Diagnostic object, and the bug
reappeared.
To create numbers in the JavaScript VM, the quick-lint-js C++ code
uses
N-API (aka Node-API). (VS Code extensions are written for Node.js.) The function I was
calling was napi_create_double which
creates a JavaScript number object from a C++
double. Maybe
napi_create_double was failing? I
double-checked the error code. napi_ok.
I was calling napi_create_double,
but my number is always an integer. (Fractional line numbers don't
make sense in VS Code.) I tried
napi_create_int32, and it worked
perfectly. Something was wrong with
napi_create_double specifically.
Hypothesis: The compiler is generating incorrect code for the call to
napi_create_double. Perhaps GCC
wasn't adhering to the Windows x64 calling convention when calling
N-API functions. I checked Microsoft's documentation on
Windows x64 ABI
and checked the assembly code generated by GCC when calling
napi_create_double. GCC was doing
the right thing by storing the number in the
xmm1 register.
Hypothesis: Some earlier code corrupted N-API somehow. I moved my test code into the extension initialization. The logged number was still corrupted, but the bug disappeared.
Hypothesis: The bug happened only for the very first number I create. I ran my test code in a loop and confirmed that only the first number is broken. This is why creating a number during initialization (for testing) made the bug disappear.
for (int i = 0; i < 10; ++i) {
  napi_value jstest;
  double original = 42.0;
  napi_status status = napi_create_double(env, original, &jstest);
  QLJS_ASSERT(status == napi_ok);
  double result;
  status = napi_get_value_double(env, jstest, &result);
  QLJS_ASSERT(status == napi_ok);
  QLJS_DEBUG_LOG("init test: %g -> %g\n", original, result);
}napi_create_double
init test: 42 -> 1.20305e-307
init test: 42 -> 42
init test: 42 -> 42
init test: 42 -> 42
init test: 42 -> 42
init test: 42 -> 42
init test: 42 -> 42
init test: 42 -> 42
init test: 42 -> 42
init test: 42 -> 42Finding the root cause
I now know that the first call to
napi_create_double creates a broken
JavaScript number. What is
napi_create_double doing?
I looked at the
C++ code for
napi_create_double
in Node.js. Nothing looked suspicious. I also looked at the Git
history. The function hasn't changed since it was introduced.
On Windows, an implib is the glue code between DLLs. In my case, a Node.js implib allowed the quick-lint-js extension DLL to call N-API functions in VS Code.
I took a peek at the implib code for
napi_create_double. Nothing looked
suspicious, but it was calling
__delayLoadHelper2. I looked at
its documentation
and found no errata about
double arguments. (But that's no
guarantee that the function is bug-free!)
napi_create_double:
  jmp    1f
1:
  lea    __imp_napi_create_double,%rax
  jmp    __tailMerge_node_napi_lib

__tailMerge_node_napi_lib:
  push   %rcx
  push   %rdx
  push   %r8
  push   %r9
  sub    $0x28,%rsp
  mov    %rax,%rdx
  lea    .text$2,%rcx
  call   __delayLoadHelper2
  add    $0x28,%rsp
  pop    %r9
  pop    %r8
  pop    %rdx
  pop    %rcx
jmp *%raxnapi_create_double and
related code generated by dlltool
When does my number get corrupted? I attached a C++ debugger (gdb) to VS Code. I set a breakpoint on the extension's initialization
and I stepped through the code. Inside
napi_create_double in the implib,
the xmm1 register contained
42.0 as expected. I kept stepping
through and didn't see any changes to xmm1.
Stepping through each and every assembly instruction to detect a
change to a register is tedious. I decided to try a new feature of
gdb: register watchpoints. I ran
watch xmm1 -thread 1, and immediately got an
answer: a function in NTDLL (part of Windows) was modifying
xmm1! Hey, that number looks familiar!
(gdb) watch xmm1 -thread 1
(gdb) continue
Thread 1 hit Watchpoint 1: $xmm1

Old value =
  {v8_bfloat16 = {[redacted]},
   v4_float = {[redacted]},
   v2_double = {42, 0},
   [redacted]}
New value =
  {v8_bfloat16 = {[redacted]},
   v4_float = {[redacted]},
   v2_double = {1.2030528096229781e-307, 0},
   [redacted]}
0x00007fff34b63006 in ntdll!RtlLookupFunctionEntry ()
  from C:\WINDOWS\SYSTEM32\ntdll.dll

(gdb) disassemble 0x00007fff34b62ffb, 0x00007fff34b63011
Dump of assembler code from 0x7fff34b62ffb to 0x7fff34b63011:
   0x00007fff34b62ffb:      movups (%rdx),%xmm0
   0x00007fff34b62ffe:      movups %xmm0,(%rsi)
   0x00007fff34b63001:      movsd  0x10(%rdx),%xmm1
=> 0x00007fff34b63006:      movsd  %xmm1,0x10(%rsi)
   0x00007fff34b6300b:      mov    (%rsi),%rbp
   0x00007fff34b6300e:      mov    %r11,%rax
End of assembler dump.xmm1 in NTDLL
I looked at the documentation for the
Windows x64 ABI. xmm1 is a volatile register that
is supposed to be saved by the caller. I looked at the
implib code, and sure enough,
xmm1 wasn't being saved. I think I found the
root cause!
Fixing the bug
My current hypothesis: The implib code should have saved
xmm1, but it didn't.
I needed to change the implib code. The code is generated by dlltool which is part of GNU binutils. So let's build binutils from source.
What a pain.
Because I previously installed binutils using MSYS, I decided to use their options to build binutils from source. I cloned the binutils-gdb Git repository, then I copy-pasted some commands from MSYS' PKGBUILD file, filling in some variables with educated guesses. (I guessed wrong a few times, of course.) Builds were slow because half my CPU was dedicated to streaming on Twitch.
Eventually, I got everything but gdb compiling. (I didn't want to build gdb, but I couldn't figure out how to build only dlltool.) However, I realized that "everything" isn't everything. dlltool didn't get built. Huh?
It turns out I broke something along the way and needed to clean-build. Yay Autotools! After a clean build, everything was built, including dlltool (but not gdb for some reason).
I told the quick-lint-js build system to use my newly-built dlltool, then fired off a build. dlltool gave me a cryptic message:
dlltool.exe: 🤖 CreateProcess 🤖Robots added by the editor
CreateProcess is a Windows API for
running .exe files. I pulled out
Procmon
to see which CreateProcess call was
failing. dlltool was trying to run as (GAS, the GNU
Assembler), but couldn't find it.
In a normal installation of binutils, all the tools are in the same
directory. However, in my development build,
dlltool.exe and as.exe were in different
directories.
I decided to run the binutils installation script, installing
everything into temporary directory called stragerusr:
$ make install PREFIX=/Projects/binutils-gdb/stragerusr
make[1]: Entering directory '/Projects/binutils-gdb/build'
/bin/sh ../mkinstalldirs /ucrt64 /ucrt64
make[2]: Entering directory '/Projects/binutils-gdb/build/bfd'
make  install-recursive
make[3]: Entering directory '/Projects/binutils-gdb/build/bfd'
Making install in po
make[4]: Entering directory '/Projects/binutils-gdb/build/bfd/po'
if test -r ../../../bfd/../mkinstalldirs; then \
  ../../../bfd/../mkinstalldirs /ucrt64/share; \
else \
  ../../../bfd/mkinstalldirs /ucrt64/share; \
fi
installing da.gmo as /ucrt64/share/locale/da/LC_MESSAGES/bfd.mo
installing es.gmo as /ucrt64/share/locale/es/LC_MESSAGES/bfd.mo
installing fi.gmo as /ucrt64/share/locale/fi/LC_MESSAGES/bfd.mo
installing fr.gmo as /ucrt64/share/locale/fr/LC_MESSAGES/bfd.mo
After a minute, I realized that binutils was being installed in
/ucrt64, not into my temporary directory. Oh no!
I canceled the install script and tried recompiling quick-lint-js. Everything was broken. To clean up the mess I made, I reinstalled everything using MSYS:
pacman -Qqn | pacman -S -
Back to fixing the CreateProcess error. I copied
/ucrt64/bin/as.exe into my build directory containing
dlltool.exe. Then dlltool worked fine.
I built the quick-lint-js VS Code extension and ran it. VS Code crashed! Hmm.
I looked at the implib generated by the new dlltool. The assembly was
different. I used a newer version of binutils than I was using
previously. The newest version has a patch to support Structured
Exception Handling (SEH). I reverted that patch, re-built the
extension, and VS Code no longer crashed. Of course, the
napi_create_double bug persisted.
I took a break. The next day, I tried dlltool with the SEH patch and it didn't crash. Huh. Maybe I screwed something up the previous day. 🤷♀️
I hacked dlltool to save xmm1. I made a few
mistakes along the way:
- wrong assembly instruction to store to memory
- used an aligned store on unaligned addresses
- restored the stack pointer incorrectly
- modified the x86 (32-bit) code instead of the x64 (64-bit) code
Eventually, my dlltool patch fixed the
napi_create_double bug! I reverted
all my debugging changes to the quick-lint-js extension and tried
again. The original bug was gone. Hurray!
__tailMerge_node_napi_lib:
  // save volatile registers
  sub    $0x48,%rsp


  mov    %rcx,0x40(%rsp)
  mov    %rdx,0x38(%rsp)
  mov    %r8,0x30(%rsp)
  mov    %r9,0x28(%rsp)
  mov    %rax,%rdx
  lea    .text$2(%rip),%rcx
  call   __delayLoadHelper2
  // restore volatile registers
  mov    0x28(%rsp),%r9
  mov    0x30(%rsp),%r8
  mov    0x38(%rsp),%rdx
  mov    0x40(%rsp),%rcx


  sub    $0x48,%rsp
jmp *%raxby an unpatched dlltool
__tailMerge_node_napi_lib:
  // save volatile registers
  sub    $0x108,%rsp
  vmovupd %ymm5,0xe8(%rsp)
  vmovupd %ymm4,0xc8(%rsp)
  vmovupd %ymm3,0xa8(%rsp)
  vmovupd %ymm2,0x88(%rsp)
  // note: ymm1 includes xmm1
  vmovupd %ymm1,0x68(%rsp)
  vmovupd %ymm0,0x48(%rsp)
  mov    %rcx,0x40(%rsp)
  mov    %rdx,0x38(%rsp)
  mov    %r8,0x30(%rsp)
  mov    %r9,0x28(%rsp)
  mov    %rax,%rdx
  lea    .text$2(%rip),%rcx
  call   __delayLoadHelper2
  // restore volatile registers
  mov    0x28(%rsp),%r9
  mov    0x30(%rsp),%r8
  mov    0x38(%rsp),%rdx
  mov    0x40(%rsp),%rcx
  vmovupd 0x48(%rsp),%ymm0
  vmovupd 0x68(%rsp),%ymm1
  vmovupd 0x88(%rsp),%ymm2
  vmovupd 0xa8(%rsp),%ymm3
  vmovupd 0xc8(%rsp),%ymm4
  vmovupd 0xe8(%rsp),%ymm5
  add    $0x108,%rsp
jmp *%raxmy patched dlltool
Finishing up
Now that I had a proven fix in dlltool, there's a problem: How can I make quick-lint-js' CI builds use the patched dlltool? I want to avoid custom toolchains for this open-source project.
Because we fully understand the root cause, I decided to
create a workaround: When initializing the extension, call
napi_create_double once and ignore
the result. For good measure, I did the same for other N-API functions
which have double parameters:
void work_around_dlltool_bug(napi_env env) {
  // Call all napi_ functions with any double parameters.
  napi_value value;
  napi_create_double(env, 0.0, &value);
  napi_create_date(env, 0.0, &value);
}However, this workaround only applies to quick-lint-js. What about other projects which might have the same issue? I emailed a bug report with my patch to the binutils bugs mailing list, and filed a bug in their bug tracker. Hopefully, the binutils developers accept my patch so others don't go through three days of debugging the issue as I did.
Conclusion
I've hit compiler bugs before, but this bug was the hardest I've squashed. Investigating and fixing it took a few days and spanned several codebases.
I'm happy I was able to live-stream the bug fixing process on Twitch and write this public post about it.
Special thanks to HPWebcamAble for reproducing the bug.